Showing posts with label Chemistry. Show all posts

06 March 2024

X-ray photoelectron spectroscopy (XPS)

Working principle & Instrumentation 


XPS instrumentation
XPS instrumentation 


XPS (photoelectron spectroscopy) is a surface-sensitive technique used to analyze the elemental composition, chemical state, and electronic state of elements on the surface of a material.

In Xps photoelectrons emitted from material as function of their binding energy in the sample, allowing for the identification of elements and their chemical states. It is highly sensitive to the top few nanometers of a material, making it valuable for surface analysis. XPS provide more athentic data than EDX.

XPS instrument typically consists of an X-ray source,usually Mg kα hv=1253.6ev line width = 0.7ev Al kα hv=1486.6ev line width=0.85ev, an hemisphere electronenergy analyzer outer negative and inner positve lining to intact electron in center, and a detector. X-rays are used to excite electrons from the sample, and the emitted photoelectrons are analyzed based on their kinetic energy (KE). XPS involves irradiating a material's surface with X-rays, which causes the emission of photoelectrons from the inner electron shells of atoms. The kinetic energy and number of emitted electrons are measured through detecter or analyser to determine the binding energy (BE) and abundance of each element providing information about the material's elemental composition electronic structure density and chemical states. Xps measures mostly top 10nm and provide surface information. Total energy of the system is hv=KV+BE+Φ si is work function, Xps can be used in line profiling of the elemental composition across the surface or 

in depth profiling when pair with ion beam itching. 


Sample Preparation Samples should be clean free of contamination. Conductive samples are preferred to avoid charging effects. Additionally, samples may need to be rotated during analysis to ensure a representative surface is probed.


Results Interpretation XPS spectra show peaks corresponding to different elements, the position of these peaks provides information about the chemical state of the elements. The intensity of the peaks is proportional to the elemental concentration. Different peaks are making in single graph shows oxidation state known as deconvolution, when one peak get difused new one is start making this 

type of peaks called satellite peaks indicate the change in the oxidation state.


XPS spectrum
XPS spectrum 


X-ray Diffraction (XRD)

Working principle & Instrumentation 


XRD instrumentation 


XRD (X-ray Diffraction) is versatile nondistructive technique used to analyze the crystallographic structure of materials by measuring the diffraction pattern of X-rays as they interact with a crystalline 

sample.

XRD provides information about crystal structure, lattice parameters, phase composition, and preferred orientation of crystallites in a sample. Many materials are made up of tiny crystallites the chemical composition and structural type of these crystals is called their phase materials can be single phase or multiphase mixture and may conatin crystalline and non cryastalline components. In an X-ray diffracto meter different crystalline phases gives different diffraction patterns. Phase identification can be perform by comparing X-ray diffraction patteren obtained from unknown samples to patterens inreference data base. In XRD atoms of the sample donot absorb X-ray at all they just reflect them .if we did not get any peak in the material its mean the material 

is amrophous other vice it will be crystalline.

The XRD instrument consists of an X-ray tube, a sample holder, a crystal monochromator or a diffracting crystal, and a detector. The instrument used to maintain the angle and rotate the sample is termed a goniometer. The X-ray beam interacts (constractive interference) with the sample and the diffracted X-rays are detected to generate a diffraction pattern. The wavelegth of X-ray used is of the same order of magnitude of the distance between the atom in crystalline lattice. This gives rise to a diffraction pattern that can be analysied by number of ways usually sherrer equation D=Kλ/βcosϴ is used for crystalline size determination D=crystallite size K=0.9 (scherrer constant) λ= 0.15406nm (wave length of X-ray source) β=FWHM(in radians) ϴ= peak position (in radians) Bragges law nλ=2dsineϴ d= nλ/2sineϴ d= interplaner spacing or d spacing (in Ǻ) is used for mesurement of interplaner spacing or d spacing.


Sample Preparation Samples should be finely powdered and homogenously dispersed to ensure representative results. Amorphous materials may not produce diffraction patterns, as XRD is most effective for crystalline samples.


Results Interpretation XRD results are typically presented as a diffraction pattern, where peaks correspond to specific crystallographic planes. The position and intensity of these peaks provide information about the crystal structure and phase composition of the materialPeak width is inversly proportion to crystal size.


XRD graph
XRD graph 


05 March 2024

Fourier Transform Infrared Spectroscopy (FTIR)

Working principle & Instrumentation 


FTIR instrumentation
 FTIR instrumentation 


FTIR (Fourier Transform Infrared Spectroscopy) is analytical technique for determining functional group and crystal orientations. Their nature may be of organic or inorganic. FTIR contain IR source to produce IR radiation Interferometer (Michelson interferometer) which contain beam splitter, stationary mirror and moving mirror. Which split the beam into two beams two possiblities are,one is destructive interference called OPD (optical path difference) height and valley (crest and trough) of IR not match in beam spliter when it rejoin and cancel the effect of each other.

ZPD (zero path difference ) height and valley (crest and trough) of IR beams match is known as constructive interferences which gives results when fall on sample.

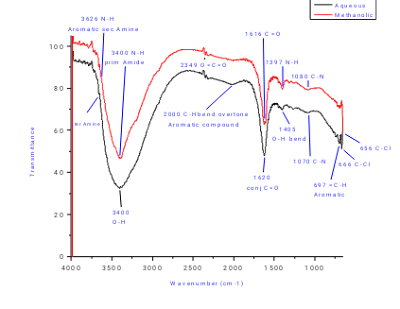
Basic principle is that electrons between different elements absorbed IR radiations at different frequencies matching to it in the range in FTIR this interaction (measures absorbance or emittence) These signals are decoded by applying techniques Fourier transformation to produced spectra usually in the mid-IR region corresponds to wavenumbers 4000 to 400cm-1 .


Sample prepration Samples for FTIR analysis must be prepared in a form suitable for transmission or reflection of infrared light. This often involves creating thin films, in disc or KBr wafer method by using potassium bromide (KBr) 3:1 ratio (3% KBR : 1% sample) mix well with each other grinding, mashing then place it in pressing disc press through hydraulic press applying pressure of 8 to 10 mega pascal to attain very thin crackless pellet place it in analyzer chamber to analyze. In direct method Liquids can analyize directly droping few drops on analyzer The goal is to present a uniform and representative sample.


Results interpretation FTIR spectra display peaks at specific wavenumbers corresponding to molecular vibrations. Peaks indicate the presence of certain functional groups or bonds. The intensity and position of these peaks provide information about the concentration and type of chemical bonds in the sample. 

Upto 4000cm-1 to 1500cm-1 is Known as functional group region 1500cm-1 to 400cm-1 known as finger print region specific for each material, match the spectra with IR data base to identify the functional group and materials.


FTIR spectra
FTIR spectra


05 February 2024

Surface Area Analyzer (SSA)

Working principle & Instrumentation 


SAA instrumentation
SAA instrumentation 


The SSA (Surface Area Analyzer) is used to measure the specific surface area of a material, providing information about its porosity and the extent of available surface for chemical interactions. 

SAA quantifies the surface area by adsorbing gas molecules onto the material's surface and measuring the amount adsorbed. The data is then used to calculate the specific surface area. SAA typically consists of a degas system to remove adsorbed gases from the material, a sample cell where adsorption occurs, and a detection system to measure the adsorbed gas quantity. Instruments may use various inert and some other adsorptive gases like nitrogen. Principle is the gas adsorption onto the sample's surface. The amount of gas adsorbed is directly related to the surface area. The BET (Brunauer, Emmett, Teller) theory is commonly employed, which assumes the formation of a monolayer (as Langmuir theory) or multilayer of gas molecules on the surface. By analyzing the gas adsorption isotherm, the surface area of the material can determined accurately.

It is essential for characterizing materials with porous structures, like catalysts, adsorbents, and powders. It provides valuable information for researchers and industries involved in areas such as catalysis,  material science, environmental science etc. Pore volume and pore area distributions in the mesopore and macropore ranges by the BJH (Barrett, Joyner, Halenda) method of gas adsorption and desorption using a variety of thickness equations including a user-defined, standard isotherm (graph of gas adsorpition vs relative pressure).


Sample Preparation Samples need to be prepared by degassing to remove any previously adsorbed gases or contaminants. This is crucial for accurate measurements. Samples are often finely powdered or have a high surface area, such as porous materials like zeolites or activated carbon.


Results interpretation The specific surface area is determined by analyzing the quantity of gas adsorbed at various pressures. A plot of adsorption isotherm (adsorbed gas versus pressure) is created. Specific surface area is calculated using models such as the BET (Brunauer, Emmett, and Teller) equation systematically and provide BET isotherm gas adsorption graph. The BET theory is commonly employed, which assumes the formation of a monolayer (as langmuir theory) and can be multilayer of gas molecules on the surface.


SAA graph
SAA graph


04 February 2024

Pore Size Distribution (PSD)

Working principle & Instrumentation 


PSD instrumentation
PSD instrumentation 


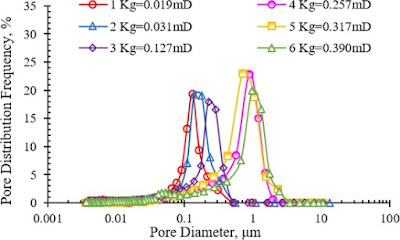
Pore size distribution analysis is used to determine the range of pore sizes within a material. This information is crucial for understanding the material's properties, especially in fields like material science, catalysis, and filtration.

PSD provides data on the distribution of pore sizes, indicating the variety of pore dimensions within a material. This information is vital for assessing how easily fluids can move through the material and its suitability for specific applications.

Various techniques are used for PSD analysis, including gas adsorption methods (often with instruments like BET analyzers (works on the BET theory principle ),

The BET (Brunauer, Emmett, and Teller) theory is commonly employed, which assumes the formation of a monolayer (as Langmuir theory) or multilayer of gas molecules on the surface. 

Mercury intrusion porosimetry (pore structure diameter volume etc), and nuclear magnetic resonance (NMR) methods. Each technique offers different insights into pore size distribution.

The principle varies based on the technique employed. In gas adsorption methods like BET, the principle involves the adsorption of gas molecules onto the surface of the material. In mercury intrusion porosimetry, mercury is forced 

into the pores, and the intrusion pressure is related to pore size. NMR methods rely on the interactions between nuclear spins and the material's structure to infer pore size distribution. Each method exploits different physical principles to 

provide information about the material's porosity.


Sample Preparation Sample preparation depends on the technique used. For gas adsorption methods, the material is typically degassed to remove adsorbed gases. In mercury intrusion porosimetry, the sample is impregnated with mercury. NMR methods require specific sample handling for accurate results.


Results interpretation PSD results are often presented as a plot showing the 

percentage of pores within specified size ranges. The shape of the distribution curve provides insights into the homogeneity of the pore size within the material.


PSD graph
PSD graph 


24 December 2023

Point of Zero Charge (PZC)

Working principle & Instrumentation  


PZC instrumentation
PZC instrumentation 


The Point of Zero Charge (PZC or pH

PZC) is a characteristic of a material's surface at which the material carries no net electrical charge. It is a critical parameter in understanding the surface charge behavior of materials, particularly in the context of colloidal systems and adsorption phenomena. It is that value of PH where surface attain neutrality.

The PZC is related to the protonation or deprotonation of functional groups on the material's surface. At the PZC, the concentrations of positively and negatively charged sites are equal, surface attain neutrality, Experimental methods involve determining the pH at which the material exhibits no net charge. This is often done by measuring the zeta potential or by titrating the material. with an acid or a base and monitoring the surface charge In salt addition method first Prepared 600ml 0.1M stalk solution of Sodium nitrate, take 40ml of this solution in fourteen different Erlenmeyer or conanical flasks one by one set the different pH value (1 to 14) of the solution with either adding acid or base drop vice through droper carefully Nitric acid (0.1 M) or Sodium hydroxide (0.1 M) by using a pH meter addjust different pH value from (1 to 14) has been set these are the initial pH (pHi) values then in each flask add desirable composite or material whose pzc want to be determin placed all these flask in orbital shaker and shake at speed of 150 rpm on the orbital shaker at room temperature for 24 hours or set the parameters of your own choice according to sample requirement. After equlibrium filter the contents, and record the pH of beaker containg the filtrate known as final pH (pHf) then find the change in pH by ΔpH=pHi _ pHf then draw the graph against ΔpH and pHi the line intersect or coside on the zero is its PZC.


Sample Preparation Sample preparation depends on the technique used in salt addition method Care fully salt solution prepared 0.1 M adjust their pH (1 to 14 by adding acidc or basic solution drope vice in it) Disperse the cleaned material in each of the prepared solutions. This could involve mixing the material with the solution and allowing it to equilibrate.


Results interpretation The pH below the PZC, the surface is positively charged, and above the PZC, it becomes negatively charged. PZC is crucial for predicting the adsorption behavior of ions and molecules onto a material's surfaces.


Figure PZC graph

Figure PZC graph 


23 December 2023

Thermogravimetry Analysis (TGA)

Working principle & Instrumentation 


Figure TGA instrumentation

TGA instrumentation 


Thermal analysis are Techniques in which a physical property of a substance is measured as a function of temperature whilst the substance is subjected to a controlled temperature programme certain techniques lie in this here we discuse TGA and DTA in detail.

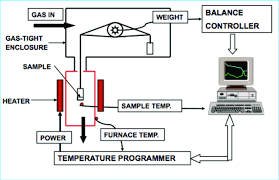
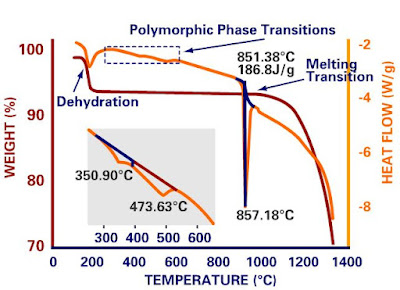
Thermogravimetry (TGA) is a technique in which the mass of a substance is measured as a function of temperature while the substance is subjected to a controlled temperature programme. The record is the thermogravimetric or TG curve or graph the mass should be plotted on the ordinate decreasing downwards and temperature (T) or time (t) on the abscissa increasing from left to right.

A thermobalance is used for weighing a sample continuously while it is being heated (in a given enivornement, air, N2, CO2, He, Ar, etc ) or cooled. The heating rate is the rate of temperature increase, which is customarily quoted in degrees per minute (on the Celsius or Kelvin scales). The heating or cooling rate is said to be constant when the temperature/time curve is linear. 

The initial temperature, Ti, is thattemperature (on the Celsius or Kelvin scale) at which the cumulative-mass change reaches a magnitude that the thermobalance can detect. The final temperature, Tf, is that temperature (on the Celsius or Kelvin scale) at which the cumulative mass change reaches a maximum. The reaction interval is the temperature difference between Tf and Ti as defined above. TG measures changes in sample mass, indicating processes such as decomposition, oxidation, or phase transitions. DTA can perform with it for physical property of substance is measured as a function of temperature at controlled temperature programme.


Sample Preparation Samples are usually finely ground and placed in a sample holder. It's crucial to have a representative sample and to account for factors like sample size and packing density, as they influence the thermal behavior.


Results interpretation In TG, weight loss or gain is observed as a function of temperature, providing information about processes like decomposition or oxidation. Plateau A plateau is that part of the TG curve where the mass is essentially constant. And decline line in grapgh shows decrease in mass as function of temperature.


Figure TGA graph

TGA graph 


Differential Thermal Analysis (DTA)

Working principle & Instrumentation 


DTA instrumentation
DTA instrumentation 


Thermal analysis are Techniques in which a physical property of a substance is measured as a function of temperature whilst the substance is subjected to a controlled temperature programme certain techniques lie in this here we discuse DTA in deatail.

DTA mesures the temperature difference between the sample and refrence materila as they both undergo the same temperature programme. The record is the differential thermal or DTA curve or thermogram; the temperature difference (∆T) should be plotted on the ordinate with endothermic reactions downwards and temperature or time on the abscissa increasing from left to right. The term quantitative differential thermal analysis (quantitative DTA) covers those uses of DTA where the equipment is designed to produce quantitative results in terms of energy and/or any other physical parameter.


Sample Preparation Samples are usually finely ground and placed in a sample holder. It's crucial to have a representative sample and to account for factors like sample size and packing density, as they influence the thermal behavior.


Results interpretation The base line corresponds to the portion or portions of the DTA curve, thermogram or thermograph for which ∆T is approximately zero. 

A peak is that portion of the DTA curve which departs from and subsequently returns to the base line. 

Endothermic peaks or endotherm, is a peak where the temperature of the sample falls below that of the reference material, i.e., ∆T is negative. 

Exothermic peaks or exotherm, is a peak where the temperature of the sample rises above that of the reference material, i.e., ∆T is positive. 

Peak width is the time or temperature interval between the points of departure from and return to the base line. There are several ways of interpolating the base

line as peak height peak width , peak area etc.


DTA thermogram
DTA thermogram 


24 April 2023

Chemistry


Chemistry


It is difficult to say definitively about the origin of the word alchemy. It is probably derived from Khem, the ancient name of Egypt. This name was given to Egypt on the basis of the black color of its soil. Alchemy developed in ancient Egyptian and Greek civilizations. This knowledge was given the name Alchemy in Arabic language.  Accordingly, later it came to be called Alchemy in English and then chemistry.


What is Chemistry 

Chemistry is the scientific study of the properties and behavior of matter. It is a physical science under natural sciences that covers the elements that make up matter to the compounds made of atoms, molecules and ions: their composition, structure, properties, behavior and the changes they undergo during a reaction with other substances. Chemistry also addresses the nature of chemical bonds in chemical compounds.

In the scope of its subject, chemistry occupies an intermediate position between physics and biology. It is sometimes called the central science because it provides a foundation for understanding both basic and applied scientific disciplines at a fundamental level. For example, chemistry explains aspects of plant growth (botany), the formation of igneous rocks (geology), how atmospheric ozone is formed and how environmental pollutants are degraded (ecology), the properties of the soil on the moon (cosmochemistry), how medications work (pharmacology), and how to collect DNA evidence at a crime scene (forensics).


History

The history of chemistry spans a period from very old times to the present. Since several millennia BC, civilizations were using technologies that would eventually form the basis of the various branches of chemistry. Examples include extracting metals from ores, making pottery and glazes, fermenting beer and wine, extracting chemicals from plants for medicine and perfume, rendering fat into soap, making glass, and making alloys like bronze.

Chemistry was preceded by its protoscience, alchemy, which operated a non-scientific approach to understanding the constituents of matter and their interactions.  Despite being unsuccessful in explaining the nature of matter and its transformations, alchemists set the stage for modern chemistry by performing experiments and recording the results.


The Muslim Scientists and their Contributions in Science


The Muslim Scientists and their Contributions in Science


The knowledge that provides understanding of this world and how it works, is science.

Systematic knowledge of the physical or material world gained through observation and experimentation is called science.

One of the most important contributions Muslims have made to society is in scientific discovery. In fact, many modern scientists are inspired by the work done by Muslim scientists from centuries ago.


Muslim Period 600-1600 AD

The science grew and flourished in early civilizations of the world.  The
 The Egyptians, the Greeks, the Romans and the Muslims contbuted much to the science.  The Musliis made a rich contribution to the knowledge in science.
They spread like shining stars on the horizon of the world of science
They made effective and invaluable services in the field of science.  This period of Muslims is almost 1000 years long (600-1600 AD).
Muslims laid the foundation of the laboratory methods.  These methods are still used in modern science.
The Muslim scientists discovered many elements e.g.  Arsenic (As), Antimony (Sb)  and Bisrmuuth (Bi) etc.
They developed and used many laboratory instruments eg funnels, crucible etc.  Many new chemical processes were also introduced by
Muslim scientists e.g.  filtration, fermentation, distillation etc.  Thus, this period provides basis for the modern chemistry.  The period of Muslims is called the period of AI-Chemists" in the history of chemistry. Muslims scientist presented science as purely "experimental or practical science".  Some well known Muslim scientists and their achievements are mentioned here.

Jabir Ibn Hayyan (721-815)

A Pioneering Islamic Alchemisth


Jabir Ibn Hayyan (721-815) Muhammad Ibn Masa al-Khwarizmi (780-850) Father of Algebra


Jabir Ibn Hayyan is generally known as the father of chemistry.  He was probably the first scientist who had a well established laboratory.  He invented experimental methods such as distillation, sublimation, filtration, extraction of metals etc.  He prepared Hydrochloric acid, Nitric acid and white lead.
Jabir Ibn Hayyan was an influential Muslim scientist believed to be the author of the Jabirian Corpus.  This text focuses on religious philosophy, alchemy, and magic.
Jabir is also credited with being one of the first people to systematically classify chemical substances.  This was an important step in the development of modern chemistry and medicine.

Muhammad Ibn Masa al-Khwarizmi (780-850)

Father of Algebra


Muhammad Ibn Masa al-Khwarizmi (780-850) Father of Algebra


Muhammad ibn Musa Al-Khwarizmi was a Muslim scientist best known for coming up with the completing square method of solving quadratic equations.

In his home country of Iraq, Khwarizmi was a prominent mathematician who wrote about algebraic equations and how to solve them.  He also wrote on trigonometry, geography, astronomy, and other subjects.

Khwarizmi is considered one of the fathers of algebra due to his work on the methods of solving quadratic and linear equations.  He was also the first person to view algebra as an independent discipline. 

Khwarizmi's work by him helped introduce the decimal number system to Europe when translated into Latin.


Yaqub Kindi (800-873)

Pioneer of reflection of light 


Yaqub Kindi (800-873) Pioneer of reflection of light


He was born in Basra, Iraq. He produced extensive research monographs work was done in the field, especially on reflection of light.


Thabat Ibn Qurra (836-901)

A Reformer of Ptolemaic Astronomy


Thabat Ibn Qurra (836-901) A Reformer of Ptolemaic Astronomy


Thabit ibn Qurra was a Turkish mathematician and astronomer notable for reforming the Ptolemaic system.  He also contributed to mechanics, algebra, and geometry.

His work on astronomy, particularly regarding the Ptolemaic system, paved the way for a new model to describe the solar system.

 Claudius Ptolemy developed the Ptolemaic system.  It proposed geocentrism to explain the motion of celestial bodies around Earth using mathematical models.

Thabit ibn Qurra discovered that a sidereal year has 365 days, 6 hours, 9 minutes, and 12 seconds.  This discovery led Nicolaus Copernicus to discover that the Earth rotates around the Sun instead of vice versa (called heliocentrism).


Al-Battani (858-929)

Ptolemy of the Arab World


Al-Battani (858-929) Ptolemy of the Arab World


Al-Battani was a mathematician and astronomer born in modern-day Turkey.  He's best known for being the first person to discover how the solar eclipse occurs.  Al-Battani figured out that it's caused by the moon being between us and the sun.

He also introduced sines and several trigonometric relationships that mathematicians use today.


Mohammed ibn Zakariya Al-Razi (865-935)

A Pioneer in Medicine


Mohammed ibn Zakariya Al-Razi (865-935)  A Pioneer in Medicine


Al-Razi was a Persian physician chemist and philospher. He wrote 26 books but the most famous book was Al-Asrar. In this book, he discussed the different processes of chemistry. He was the first chemist to divide the chemical compounds into four types and also divide the substance into living and non-living origin. He prepared alcohol by fermentation.

He is most notable for pioneering medical science.

He is also credited with being the first person to distinguish between smallpox and measles.  Even though he achieved this feat, Al-Razi didn't have much luck convincing anyone that he was right about it—people just thought he had gone crazy.

He's also known for writing the first pediatrics book, and he taught students how to treat patients.

Al-Razi was one of the earliest experimentalists in medicine.  He believed that symptoms were not caused by magic or spirits.

His most important contribution from him was his dedication to empirical evidence instead of superstition or relying on prior knowledge.  He believed that everything should be tested before being accepted as fact.


Abu Nasr Al-Farabi (872-951)

One of The Greatest Ancient Islamic Philosophers


Abu Nasr Al-Farabi (872-951) One of The Greatest Ancient Islamic Philosophers


Abu Nasr Al-Farabi was a Muslim philosopher, mathematician, and cosmologist.  He is best known for his works in logic, metaphysics, political philosophy, and ethics.

Al-Farabi was born in present-day Afghanistan when the Islamic empire was expanding rapidly across Asia.  As a result, he was exposed to different cultures from an early age.

This Muslim scientist is considered one of the greatest thinkers of the Islamic Golden Age.  He was also a pioneer in sociology, psychology, and political philosophy.


Abu Hanifa ad-Dinawari (895-902)
Father of Arabic Botany


Abu Hanifa ad-Dinawari (895-902) Father of Arabic Botany


Abu Hanifa ad-Dinawari was a Persian polymath and the author of the Book of Plants.  He is notable for his contributions to mathematics, astronomy, and botany.

Dinawari pioneered Arabic botany by creating an index that documented all the different types of plants.

His plant book by him was one of the most important works on botany in the medieval Islamic world.  It consists of six volumes and more than 600 pages.

This treatise contains information about plants—their names, and characteristics.

Ad-Dinawari was also one of the first Muslim scientists to examine the relationship between astronomical concepts and plants.


Abul-Qasm Ammar Ibn Ali al-Mosli (900-1000)

The inventor of the hypodermic syringe


Abul-Qasm Ammar Ibn Ali al-Mosli (900-1000) The inventor of the hypodermic syringe


Ammar ibn Ali Al-Mawsili was an Arab ophthalmologist known for inventing the hypodermic syringe.

He used this hollow needle to remove cataracts from patients' eyes.  This allowed him to perform surgery on their eyes without damaging any of their other organs.

Inventing the hypodermic syringe was not just one of his many accomplishments—it was a milestone in the history of medicine.

Kitab al-Muntakhab fi ilm al-Ayn wa Mudawatiha bi'l Adwiya wal Hadid (Book of Choices in the Treatment of Eye Disease and Its Medicines and Medical Instruments), deals with anatomy, pathology and describes six case histories for cataract surgery and a  case of optic neuritis.


Al-Hasan Ibn Al-Haytham (965-1039)

Father of Modern Optics


Al-Hasan Ibn Al-Haytham (965-1039) Father of Modern Optics


Hee was Born in Basra , Iraq during the Islamic Golden Age, Ibn Al-Haitham is best known for paving the way for modern scientists. 

He produced extensive research monographs on metrology, specific gravity and tides.

His Book of Optics named Kitab ul Manazir was one of the most important works on optics ever written. It offered a new understanding of light and vision.

He also considered as the inventor of pin-hope camera.

Al-Hasan is also known for pioneering the scientific method. This process involves careful observation and experimentation to test hypotheses about how things work.

Today, scientists use the scientific method to study a wide range of topics. It has helped us to understand everything from the solar system to human behavior.

In the field of Chemistry, he understood the different chemical procedures and chemical  combinations.

He determined the densities of different substances.


Al Beruni (973-1048)

Shape of earth shape and phases of sun and moon 


Al Beruni (973-1048) Shape of earth shape and phases of sun and moon


He is Afghan scholar and wrote about 150 books on Physics, cosmology, geology, culture, archeology, and medicine.

Al Beruni discussed the shape of earth the movement of sun, moon and phases of moon.


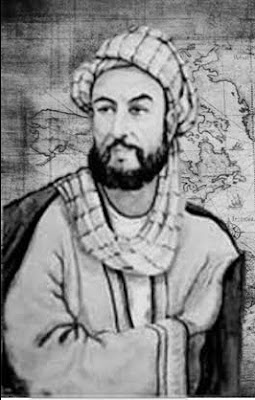
Ibn Sina (980-1037)

Father of Medicine


Al Beruni (973-1048) Shape of earth shape and phases of sun and moon


Ibn- sina is generally known as the Aristotle of the Muslim's world.

Abu Ali Ibn Sina, or Avicenna as he was known in the West, was a prominent Muslim scientist.  He was a physician and philosopher who wrote on several topics, from alchemy to medicine.

He is famous for his contributions in the fields of Medicine, Mathematics, Astronomy, Medicinal chemistry and philosophy.

He is the first scientist who rejected the idea, that base metals can be converted into Gold.

He wrote more than hundred books. These books taught in Europe for centuries. 

His notable books by him include The Book of Healing and The Canon of Medicine.  Medieval universities used his books of him as standard medical texts until the Renaissance.  Avicenna's work by him was so influential that he became known as "the most famous physician of the Islamic Golden Age" by historians.


Ali Ibn As al-Kahhal (1010-1038)
was a pioneer in Waftalmullah


Ali Ibn As al-Kahhal (1010-1038) was a pioneer in Waftalmullah


Ali ibn Isa al-Kahhal was an ophthalmologist who made his mark in medieval science.  His book Memorandum of the Occultists was one of the most influential texts during this time.  It covered many eye diseases and their treatments.

In addition to providing information about specific eye disorders, Isa al-Kahhal also illustrated the anatomy of the eye itself.

This talented scholar is often credited with helping bring ophthalmology into its modern form.  His work on this subject predates that of many European scientists by hundreds of years.  It shows just how advanced Islamic science was during this period.


Ismail al-Jazari (1136-1206)

Father of Robotics & Inventor


Ismail al-Jazari (1136-1206) Father of Robotics & Inventor


Al-Jazari was a scholar and polymath who lived in the 12th century.  He is noted for his work in many fields of science, including robotics and mechanical engineering.

In addition to being an astronomer, he was also an inventor who developed the first elephant clock and other devices that were used during the Arab civilization.

Al-Jazari's work in engineering began with a handbook for building devices.  This text is known as “The Book of Knowledge of Ingenious Mechanical Devices.”  It contains detailed descriptions of 50 mechanical devices used during his time and instructions on how to build them.

Besides these significant contributions to engineering, Al-Jazari developed several other types of innovative devices.  This work set the stage for the first robot.


Ibn al-Baytar (1197-1248 AD)

The Man Who Recorded Medieval Medicine


Ibn al-Baytar (1197-1248 AD) The Man Who Recorded Medieval Medicine


Ibn al-Baytar was an influential Arab physician and botanist from the Middle Ages.  Not only was he an expert in Arabic medicine, but he also had a great knowledge of plants and their medicinal properties.
In his time, Ibn al-Baytar was one of the most well-known Muslim scholars.  He wrote many books on the subjects that interested him, including medicine and botany.
Ibn al-Baytar's work is used today by modern researchers studying medieval medicine and science.

Ibn al-Nafis (1213-1288)

Father of Pulmonary Circulation of Blood


Ibn al-Nafis (1213-1288) Father of Pulmonary Circulation of Blood


Ibn al-Nafis was an Arab polymath and physician who lived in the 13th century.  He is notable for contributing to medical science and Islamic philosophy.  Many modern medical practitioners continue to cite his work to this date.

Al-Nafis produced the world's first description of pulmonary blood circulation.  He discovered that pulmonary blood circulation begins at the heart's right ventricle and continues through capillaries in the lungs before returning to the left atrium via pulmonary veins.

Al-Nafis also described how blood passes through capillaries between arteries and veins (known as capillary circulation).


Ibn Khaldun (1332-1406)

Social scientist 


Ibn Khaldun (1332-1406) Social scientist


One of The Greatest Social Scientists of Medieval Islam

Ibn Khaldun was an expert in Islamic social sciences.  He is notable for popularizing the Islamic perspective on sociology, historiography, demography, and economics.

As an Islamic scholar, Ibn Khaldun helped Ottoman historians analyze the Ottoman Empire.

He also wrote on various topics of history, such as politics and economics.  His book of his titled Introduction provided valuable information on how to study history and how it is related to other disciplines such as sociology and economics.


Piri Reis (1465-1553)

Navigator & Cartographer


Piri Reis (1465-1553) Navigator & Cartographer


Piri Reis was a Turkish navigator and cartographer who lived in the 16th century.  He's notable for making one of the oldest maps known today, which detailed the coastlines of Africa and Europe.

His text Book of Navigation described navigational techniques and ports along the Mediterranean Sea.

Piri Reis had access to some of the most advanced scientific knowledge of his time about him.  I have used it to create maps that are still resourceful.


Famous Pakistani scientists of current era 

Mohammad Abdus Salam (1926-1996)

Presenter of Electroweak unificationt theory


Mohammad Abdus Salam (1926-1996) Presenter of Electroweak unificationt theory


(29 January 1926- 21 November 1996), was a Pakistani theoretical physicist.  A major figure in 20th century theoretical physics, he shared the 1979 Nobel Prize in Physics with Sheldon Glashow and Steven Weinberg for his contribution to the electroweak unification theory.
He was the first Pakistani to receive a Nobel Prize in science.

Abdul Qadeer Khan (April 1936-10 October 2021)

Father of Pakistani Atomic bomb 


Abdul Qadeer Khan (April 1936-10 October 2021) Father of Pakistani Atomic bomb


Dr. Abdul Qadeer Khan known as A. Q. Khan (born in 27 April 1936 bhopal India) is a Pakistani nuclear physicist and a metallurgical engineer, who founded the uranium enrichment program for Pakistan's atomic bomb project.  He founded and

Established Kahuta Research Laboratories (KRL) in 1976, and served as both its Senior Scientista nd Director-General until he retired in 2001.

Pakistan become 1st Muslim and 7th nuclear power in the world because of dr khan in 28 may 1998 with testing of seven nuclear blast in Balochistan chagi.


Pagination:

1 2 3 4 5 6 7 8 9 10 11 12